With the election season upon us, now is a good time to review the impact that elections can have on the stock market. Unfortunately, it’s not so easy to boil down election results and make highly confident predictions about what will happen in the ensuing years.
It would be convenient to identify a straightforward explanation for market outcomes, but doing so is simply unrealistic, as markets are a melting pot of many different factors with constantly changing impacts. For example, which is more important, the person who is president or stock market price-to-earnings multiples? What about the direction of interest rates? Inflation? Unemployment? Strength or weakness of the economy? The list of factors that influence market performance goes on and on.
Of course, who is in the White House and Congress impacts a myriad of regulations, tax laws, and government programs, but to make investment decisions based on the outcome (or expected outcome) of a single election can be dangerous.
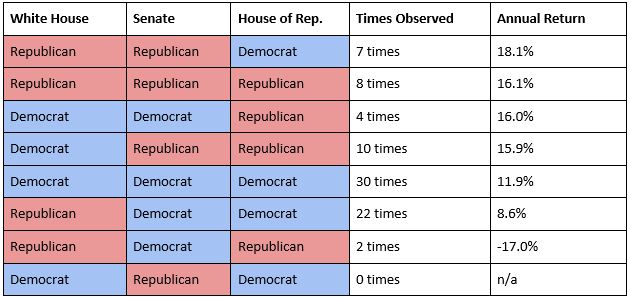
That said, it can be informative to look back in time and see how markets have performed under different political environments. JP Morgan did just this by reviewing the calendar year results of the S&P 500 from 1937–2019 and categorizing these annual returns based on which party controlled the White House and Congress. Let’s see how the S&P 500 performed under several different scenarios:
A Sample of Market Returns: 1937 – 20191

The good news from these results, if we can safely draw conclusions, is the majority of combinations that have occurred have resulted in positive investment performance. And isn’t that what is most important?
To get very technical with these sets of results would require looking at the full range of returns during all the time periods studied and doing additional statistical analysis. Even then, is this truly a cause and effect relationship? Do the results really provide us anything predictive?
Many investors (from both sides of the aisle) seem to fear that the stock market will perform poorly following the November 3rd elections. But given the historical election results and subsequent stock market performance, it would appear that investors would do well to disregard the upcoming election when it comes to reviewing their portfolios. They should instead focus on what they do know — their own situation and wealth management objectives — and make sure their portfolios have an appropriate mix of investments to meet their long-term needs and risk tolerance.
If you’d like any help in that pursuit or a customized portfolio analysis prior to Election Day, we invite you to connect with our team. Our goal is to make you feel more confident about the road ahead, whatever that brings.
[1] Source: Standard & Poor’s, U.S. House of Representatives, U.S. Senate, White House, J.P. Morgan Asset Management. Stock market returns are total returns and include dividends. Average annual returns are calculated using year-end to year-end S&P 500 levels. Data are as of September 25, 2020.

