
Marice Nach was featured in the summer/fall edition of Caregiving Magazine. Along with other industry experts, she responded to questions on the topic of retirement and aging. These include challenges...

The last 15 months have been a blur. Honestly, it’s impossible for me to start a piece I write with any other thought besides this. But things are trending in the right direction. We have [partially] re-opened our office here in Deerfield, we are finding ways to safely gather with friends, family, colleagues, and clients, and not to brag, but my five-year-old daughter scored two goals in her soccer game last week.
As I reflect on this period, I think a lot about “time” in general. It’s hard for me to grasp how some of the days seemed so long while the months and year passed so quickly. I’ve learned that it’s best not to get caught up in daily noise spewed by the news media, as I know it’s important to have a long-term view.
When it comes to financial markets and personal finance, the events of the past year have reinforced my belief in the importance of having a long-term mindset. Here are four reasons why I’m an investor who’s in it for the long run:
I love the magic of compound returns.
Compound returns (also referred to as compound “interest” or “growth”) are arguably the most powerful tool at an investor’s disposal. They are earnings on an investment, based on both the initial principal and the accumulated earnings from previous periods. With compound returns, investors can make interest on the growth they have already had with their investment. “Earnings on earnings” is a good way to think about this.
I’m intentionally starting this piece with compound returns because I’ll be circling back to it a couple of times later on.
A great way to think about the long-term impact of compound returns is by visualizing a snowball in motion. Like a snowball that rolls downhill, it slowly picks up speed and size at first, but really takes off over the long run as gains build on top of gains.
Numeric examples of compound returns are also quite astounding. Consider the following example:
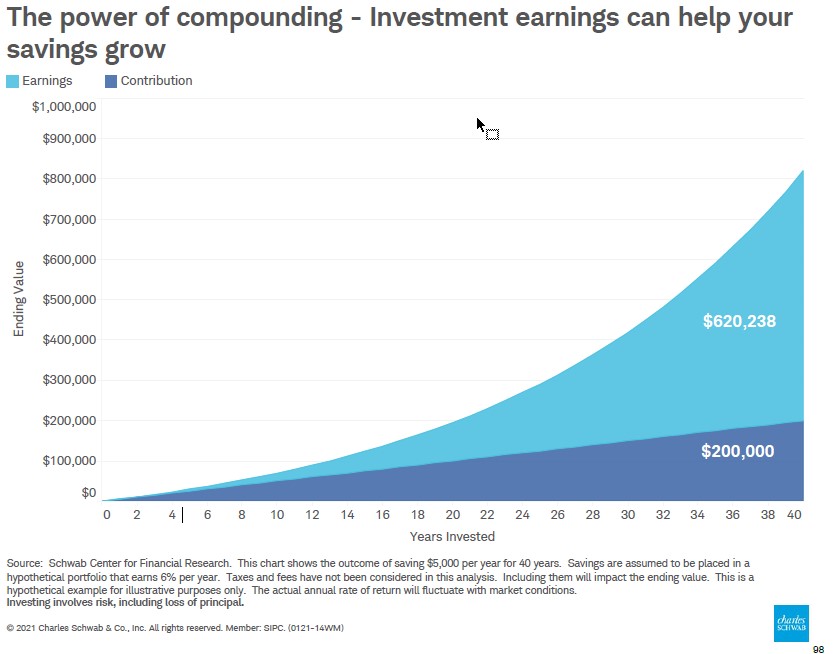
This graph shows two different outcomes of saving just $5,000 per year for 40 years. The dark blue assumes no investment returns (similar to what you get in a savings account or on a CD right now), and the light blue shows the portfolio growth of instead earning 6% per year. Big difference, right? Right! My favorite part of this graph is that the shape of the light blue line is more exponential than linear. This is what compound returns can do over a long time period; the trajectory of your earnings can effectively accelerate upwards.
Another hopefully straightforward example: If you have a $1M stock portfolio and make 8% per year, it will take nine years for that $1M to turn into $2M. Not bad! Well, over the next nine years at the same growth rate, your $2M turns into $4M. Same time period, but twice as much dollar growth ($2M instead of $1M)! I’m on a word limit here, so I’ll spare you the details of what happens over the next nine years, but you can get the idea now of the trajectory.
This is generally how compounding works over time. Small gains can eventually add up into big gains if you let them. This is a good enough reason alone to have a long-term mindset, but there are a few other reasons as well.
I don’t get swept up in the mania.
Christine Benz, the Director of Personal Finance for Morningstar, sent this tweet earlier in the year:
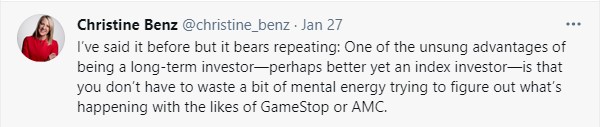
The current plight of so-called “meme” stocks is a great example of how some investors have chosen to cede any sense of control over an investment portfolio and just ride the wave. I do not know what is going to happen next with AMC. It’s a fascinating story, but I can’t fully wrap my head around it. One thing I feel confident in is that it feels more like a short-term gamble rather than a long-term investment.
Just last week, Clover Health was the newest company to get caught up in the hysteria. On Tuesday, June 8, trading volume in Clover was almost 30x the three-month daily average. And the rise in the value of the stock had nothing to do with positive news related to the company’s earnings or business model. It was mostly associated with retail traders discovering that there were some large short-sellers who would be in trouble if the stock price happened to rise.
I’m ok missing out on whatever happens with this one stock because I am focused on the light blue portion of the graph above. Sure, we can’t control what the broader stock market does over short to intermediate periods of time. But I’ll take my chances over the long-term with a portfolio of diversified funds.
It helps me to stay disciplined.
I love structure. I love it so much it actually bears repeating. I love structure. At home, we run the dishwasher every night before bed, and we read two books to each of our daughters, like clockwork.
My love for structure bleeds into my investing mindset as well. But being disciplined can be challenging when it comes to looking at shorter-term periods of market returns.
The bar graph below shows (from left to right) the annual returns for the S&P 500 dating back to 1980, and the red dot indicates the largest intra-year declines during each of these years.
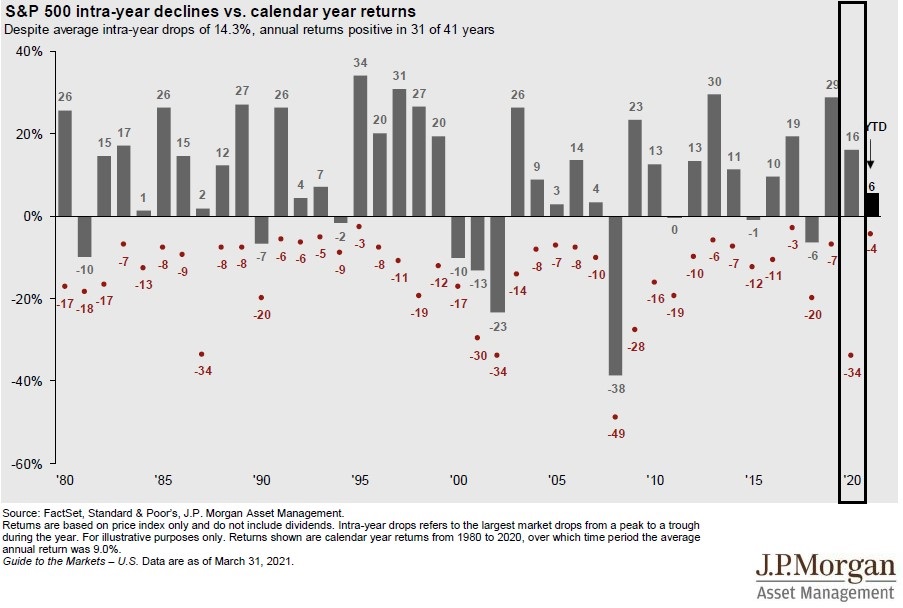
So, for example, last year, the S&P 500 ended up +16%, but during the year, there was at one point a 34% drawdown! Seeing a portfolio decline by these amounts, year-in and year-out, can take its toll. But the header at the top of the graph really makes the best argument for long-term investing: The stock market (as measured by the S&P 500) had positive annual returns in 31 of the past 41 years, even though, on average, there is one peak to trough decline of 14.3% per year.
Declines in the stock market are part of being a long-term investor, and having a long-term mindset certainly helps me keep structure in my portfolio and remain disciplined. I view these inevitable declines as the cost of admission for the tremendous compound returns I mentioned earlier.
I can disregard the negativity.
I know I said earlier that I choose to ignore the headlines. Well, nobody’s perfect, and because I am a glutton for punishment, I receive push notifications for the CNBC app on my phone. Last week, I received this:
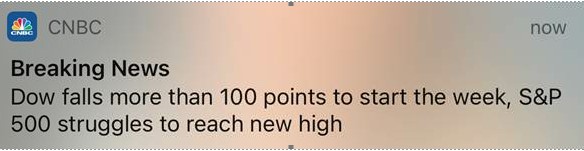
For some context on this headline: On this day, the Dow was down a whopping (sarcasm intended) 0.36%, and the S&P 500 was down 0.08%. So, in a day that the S&P 500 was down less than 1/10 of 1%, the CNBC headline read that the stock market struggled to reach new highs. Interesting word choice, if you ask me. I continually have to remind myself that the financial media’s job is to entertain. And headlines, often negative, get the attention of viewers.
In a recent episode of the Financial Success Advisor podcast hosted by Michael Kitces, he has Dan Moisand (Principal of Moisand Fitzgerald Tamayo) on to talk about his practice. In this podcast, Dan gave an example of how he discusses financial media with prospective clients (in response to a question about the media):
The first step in managing that and converting people is not to take them on as clients if they’re not willing to be converted. So, what I mean:
In the initial meeting, I’ll ask, “Do you watch a lot of cable news or personal finance news like CNBC?”
And some of them say, “Yes.”
And [I’ll say], “Are you willing to quit?” Flat out, are you willing to quit?
I love this quote. That said, of course, there is nothing wrong with watching financial news. There is, after all, a never-ending amount of information to consume and learn. I’m just saying that by being a long-term investor and taking alarmist headlines with a grain of salt, I’m able to set aside the urge to take any short-term actions based on what I see on my television or phone.
—–
As a long-term investor, it is important to remember that short-term results for the stock market are unpredictable. While there are many up days, there are, in fact, almost just as many down days.
One of my favorite financial writers, Michael Batnick, recently shared some good data to support this. He showed that the stock market (this time measured by the Dow Jones Industrial Average) has only been positive 52% of all days. It doesn’t seem like a very high percentage, right? Well, I’ll leave you with this follow up stat from the same article:
Since 1970, the Dow has compounded at less than 0.03% (or 3/100 of 1%) per day. Since then, it’s up more than 3,000%.
I’m in it for the long run, and I think you should be too. Please reach out to our team if you would like to discuss further or if we can help you build a financial plan that keeps your focus on the long-term.