Let’s start with a basic question – what exactly is inflation?
Inflation is an effective decrease in the value of a currency, which happens when there is an overall increase in the price of goods and/or services in an economy.
One factor that likely contributed to the current inflationary environment is the Federal Reserve’s (Fed) easy monetary policy. Specifically, if the Fed prints money and distributes it, the results will be inflationary because there’s more money floating around that people can and do spend.
Let’s take a closer look at the results of the monetary policy that the Federal Reserve has implemented over the last two years.
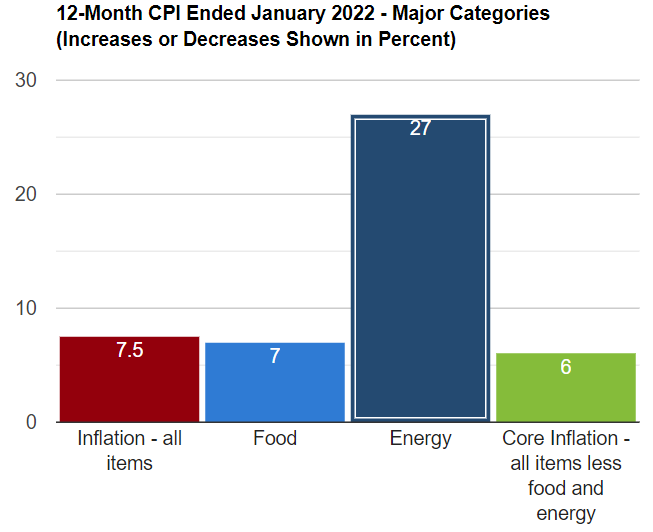
The chart below was produced by the U.S. Labor Department’s Bureau of Labor Statistics and shows the rate of inflation over the last twelve months for a few different categories.[1] You can see that energy shows by far the largest percentage increase over the last year at 27%. More specifically, as it relates to a typical consumer, a gallon of gas today costs $3.65 versus $2.72 a year ago. This works out to an increase of 34.2%. Now the impact of inflation is becoming clearer.

Also, as shown in the chart, overall consumer prices rose 7.5% annually at the end of January. This was the highest inflation reading since February 1982. About half of the total inflation can be attributed to higher prices for energy and cars, the Bureau of Labor Statistics reported. The other half is food, housing, furnishings, appliances, and other goods, all of which are affected by pandemic-related supply problems.
Inflation continues to weigh heavily on consumers, as noted by the recent Index of Consumer Sentiment from the University of Michigan. The index dropped to an 11-year low in February. Over half of those surveyed stated that they expect their household income to decline in the year ahead when adjusted for inflation.[2]
It appears that inflation will remain elevated through 2022. With inflation running at a 40-year high, the Fed has no choice but to tighten the monetary policy quickly to get inflation expectations under control. Rising interest rates would increase borrowing costs and encourage people to spend less and save more. Fewer dollars circulating in the economy means slower economic growth and less inflation.
Interest Rate Hiking Cycle
The federal funds rate is the interest rate at which banks and other depository institutions lend money to each other, usually on an overnight basis. This year, market participants are collectively forecasting (via the federal funds futures markets) six 0.25% rate hikes, bringing the range up to 1.50% – 1.75%.[3]
Liftoff for the first interest rate hike is expected to occur in March. The pending interest rate increases have the equity markets spooked. The interest rate moves would increase borrowing costs for businesses and consumers from near zero — where they’ve been since the beginning of the Covid pandemic.
For some corporations, in the short-term to intermediate-term, higher borrowing costs coupled with higher inflation could squeeze profits. Lower earnings, in turn, may lead to lower stock prices. For consumers, higher interest rates increase the cost of consumer borrowing, reduce disposable income, and therefore limit the growth in consumer spending. Less consumption should eventually lead to lower inflation (at least that is the goal).
How Inflation Affects Stock Prices
While some companies can react to inflation by raising their prices, others who compete in a global market may find it difficult to stay competitive with foreign producers that don’t have to raise prices due to inflation. In an environment with accelerating inflation, certain parts of the stock market tend to perform better than others, as noted in the following table.
Average 1-Yr Forward Style Returns for Months with the CPI > 3% Year-Over-Year
| U.S. vs. Rest of the World | Value vs. Growth | Small vs. Large | |
| Accelerating Inflation | 3.28 | 10.38 | 4.73 |
| Decelerating Inflation | 5.65 | -5.69 | 1.51 |
Sources: US BLS, Bloomberg, MSCI, FTSE Russell, Bespoke Investment Group Calculations
The above chart is a bit confusing and needs a little clarity. As measured by the CPI, the chart starts with inflation greater than 3%. It then shows the spread in returns in asset sectors when inflation increases or decreases. For example, when inflation is above 3% and accelerating, value stocks have outperformed growth stocks on average by 10.38%. Conversely, when inflation is above 3% but decelerating, value stocks have underperformed growth stocks by -5.69%.
A big challenge for investors is that we don’t know if inflation will accelerate further or begin to recede. That’s why we typically advise against making dramatic portfolio moves based on historical data, including what’s shown in the table above.
Moving Forward
The tug of war between the Fed’s interest rate hikes and inflation will continue to play out during the year, and the Fed will need to strike a delicate balance. If it gets the tightening cycle wrong, it could cause a recession. As of this writing, 2022 looks recession-free, but later years look potentially challenging. The wildcard for 2022 is how many interest rates hikes the Fed orchestrates and the magnitude of the rate increases.
Closing Thoughts
We advise our clients not to react to short-term swings in the stock market. This behavior could lead to poor results and potentially undermine a long-term plan.
Once you’ve established your investment goals and time horizon, choose an investing strategy, and stick with it. We encourage all investors to prepare for continued market volatility, including rebalancing their portfolio as needed to align it with your risk profile. If you have further questions on this topic or would like to discuss your portfolio, please connect with our team.
[1] U.S Bureau of Labor & Statistics (Link)
[2] Consumer Sentiment Sinks to Decade Low, Michigan News University of Michigan (Link)
[3] Fed Rate Hikes: Expectations and Reality, CME Group (Link)


