l have written in the past about how I am a long-term investor. While past performance does not guarantee future results, I always keep in mind historical data to help me stay invested in the market during rough patches.
Some of the statistics that I consistently remind myself of include:
- The stock market, as measured by the S&P 500, has been positive 75% of calendar years dating back to 1980, even though the average intra-year drop has been over 14%.[1]
- The S&P 500 has been positive for 88% of 5-year periods and 94% of 10-year periods dating back to 1928.[2]
- If you had invested at the stock market peak in October 2007, just before the financial crisis and ensuing stock market drop of over 50%, you would still be up approximately 9.5% per year if you had stayed invested through today. This return – which is near the long-term average for stocks -includes the financial crisis, the 2018 correction, the 2020 Covid sell-off, and the recent 2022 bear market from inflation, among other declines.[3]
These are all great data points that support the long-term investor mindset.
But I recently came across two stock market stats that I cannot stop thinking about. Both are timely, given current financial conditions and recent market performance. They are currently my favorite stats about the stock market.
Stat #1
Since 1924, there have been 34 calendar years where the S&P 500 has finished up 20% or more versus just 26 total down years.[4]
Said differently, over the past century, the stock market has been up greater than 20% in a calendar year more times than it has been negative in a calendar year – not negative 20%, but literally any negative amount.
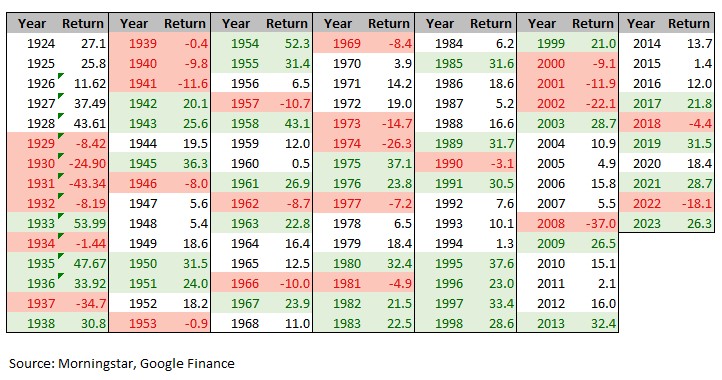
Effectively, using the past century of data, the stock market is more likely to be up 20% over the course of a year than it is to be at all negative. Seem too good to be true? Here is the underlying data:

The above graph shows all calendar year returns dating back to 1924. I’ve highlighted in red the years with a negative return (24 total) and highlighted in green the years with a positive return of 20% or greater (36 total). I’d be happy if the green represented any returns that were positive, let alone positive 20%!
I’m shocked by this. In one sense, it’s quite comforting that there have only been negative years in the market 24% of the time. But I find the other side of the coin to be quite staggering. Over the same time, the market has returned at least 20% in a calendar year 36% of the time! More than 1 in 3 years!
Of course, there will be extended periods where we do not have a +20% year, for example, per the table above, 1968-1974. Or, look further back to the Great Depression years, which I hesitate to even include because the Federal Reserve was just in its infancy at this time and didn’t have the ability to provide the financial backstop that it does now. However, a sample size of 100 years is large enough to give me peace of mind that if I just stay invested, I’ll be able to experience plenty of transformative up years.
Stat #2
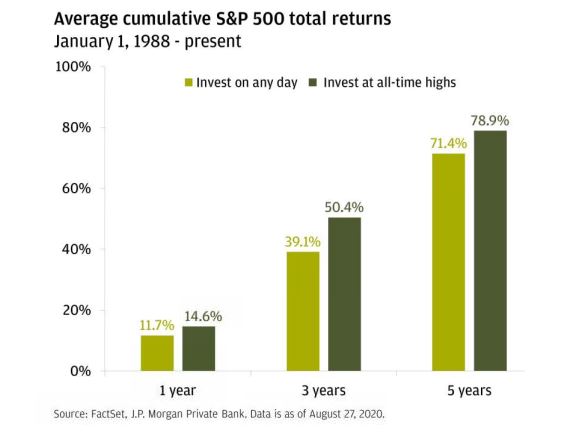
Going back to 1988, if you invested in the S&P 500 on any random day, the average return exactly one year later would be nearly 12%. But if you only invested on the day of an all-time stock market high, your average return one year later would have been nearly 15%.[5]
So, dating back almost 45 years, one-year expected returns are actually higher when the market is at an all-time high than on any randomly selected day! This trend continues for 3-year and 5-year periods, as shown on this graph (note, data from 2020):

Here, you see that the average cumulative 3-year return when investing at all-time highs is over 10 percentage points greater than on a randomly chosen day, and the average cumulative 5-year return when investing at all-time highs is over 7 percentage points greater than on a randomly chosen day.
And this notion of investing at market highs has been a frequent topic of conversation over the past few months.
At the beginning of this year, the S&P 500 returned to all-time highs, rising approximately 45% from its last low in October 2022.[6] While a rise of this magnitude can feel euphoric for investors, it can also be somewhat unnerving, as it is easy to buy into the narrative that a stock market at an all-time high must soon fall. But, as the above data shows, nothing is more bullish than all-time highs.
This may seem counterintuitive for those who believe in mean reversion as it relates to financial markets. The reality is that while some parts of financial markets are cyclical (like growth stocks relative to value stocks or the prices of commodities), the overall stock market tends to trend. And usually, it trends up. In fact, since 1950, the stock market has been in a bull market 83% of the time.[7]
Conclusion:
You may be tired of hearing me talk about the importance of being a long-term investor, but I feel strongly about it. So much so, that I wrote about it in 2020, 2021, 2022, and 2023.
But how do you look at the data above and feel any differently? We have decades and decades (and, in some cases, a century) of data to support the argument.
If you have concerns about the market or are looking for a steady hand to help you formulate a plan to stay invested, the team at Strategic Wealth Partners is ready to help.
[1] JP Morgan, Guide to the Markets (Link)
[2] Capital Group, Time Not Timing is What Matters (Link)
[3] Ben Carlson, What If You Invested at the Peak Right Before the 2008 Crisis? (Link)
[4] Ben Carlson, What Happens After a 20% Up Year in the Stock Market? (Link)
[5] JP Morgan, Is It Worth Considering Investing at All-Time Highs? (Link)
[6] Sam Ro, Even Strong Stock Market Years Can Get Very Stressful (Link)
[7] Callie Cox, History of Bull and Bear Markets (Link)
Disclosure:
This article contains general information that is not suitable for everyone. The information contained herein should not be constructed as personalized investment advice. Reading or utilizing this information does not create an advisory relationship. An advisory relationship can be established only after the following two events have been completed (1) our thorough review with you of all the relevant facts pertaining to a potential engagement; and (2) the execution of a Client Advisory Agreement. There is no guarantee that the views and opinions expressed in this article will come to pass. Investing in the stock market involves gains and losses and may not be suitable for all investors. Information presented herein is subject to change without notice and should not be considered as a solicitation to buy or sell any security.
Strategic Wealth Partners (“SWP”) is d/b/a of, and investment advisory services are offered through, Kovitz Investment Group Partners, LLC (“Kovitz), an investment adviser registered with the United States Securities and Exchange Commission (SEC). SEC registration does not constitute an endorsement of Kovitz by the SEC nor does it indicate that Kovitz has attained a particular level of skill or ability. The brochure is limited to the dissemination of general information pertaining to its investment advisory services, views on the market, and investment philosophy. Any subsequent, direct communication by SWP with a prospective client shall be conducted by a representative that is either registered or qualifies for an exemption or exclusion from registration in the state where the prospective client resides. For information pertaining to the registration status of Kovitz Investment Group Partners, LLC, please contact SWP or refer to the Investment Advisor Public Disclosure website (http://www.adviserinfo.sec.gov).
For additional information about SWP, including fees and services, send for Kovitz’s disclosure brochure as set forth on Form ADV from Kovitz using the contact information herein. Please read the disclosure brochure carefully before you invest or send money (http://www.stratwealth.com/legal).


